SEGGER SystemView
Real-Time Software Analysis Tool
SystemView records the runtime behavior of an embedded system for in-depth analysis and visualization
Overview
SystemView is a real-time recording and visualization tool for embedded systems. It reveals the true runtime behavior of an application, going far deeper than the system insights provided by debuggers. This is particularly effective when developing and working with complex embedded systems comprising multiple threads and interrupts. SystemView can ensure a system performs as designed, track down inefficiencies, and find unintended interactions and resource conflicts.
![]()

Key features
- Continuous real-time recording of an embedded system
- Capture tasks, interrupts, timers, resources, API calls, and user events
- Recording via J-Link and SEGGER RTT Technology, IP, or UART
- Live analysis and visualization of captured data
- Minimally system intrusive
- Works on any CPU
- Works with any RTOS and with bare-metal systems
- SEGGER embOS, emNet, and emFile API call tracing as standard
- uC/OS-III, Micrium OS Kernel, and FreeRTOS instrumentation included
- Free for non-commercial use without limitation
Recording events
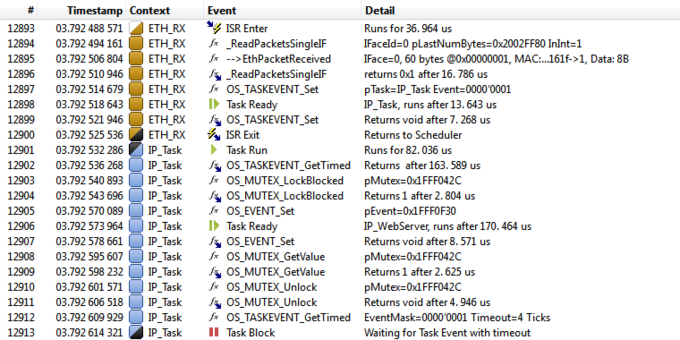
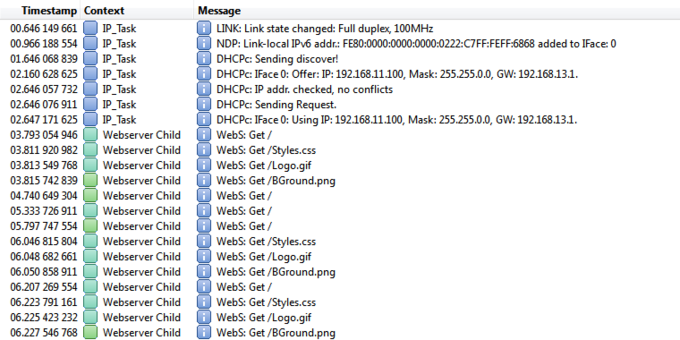
On the target system, SystemView records events that happen during runtime. These can be interrupts, timers, task switches and scheduling with an RTOS, API function calls and returns, or user events and messages. The events are retrieved, analyzed and visualized in the SystemView application, while the target keeps running. The Events Window in SystemView displays the recorded events along with more information.
To maintain low communication overhead on the target system, SystemView only records basic information.
SystemView analyzes all information from the events and shows:- The API function name and its parameters and values
- The recording time or system time when the call happened
- The task in which the call happened
- The duration of the API call
Sample output: "API function with Id x has been called with parameter values y and z and n ticks after the last event”.
A regular event is 4 to 8 bytes long and takes about 1 µs to be recorded at 200 MHz. With 10,000 events per second the overhead added by SystemView is less than 1% of the CPU time and the amount of data is easily within the bandwidth limits of the recorder.
The timestamps for events can be as accurate as 1 CPU cycle, which equates to 5 ns on a 200 MHz CPU.
The event timeline window
Most embedded systems do not have linear code execution. They implement interrupts for timers and use of peripherals, or might use an RTOS with multiple tasks.
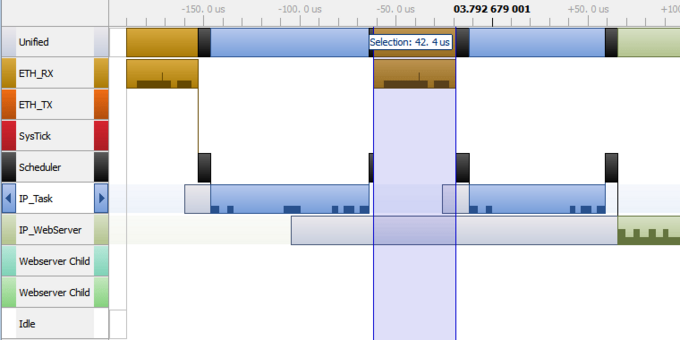
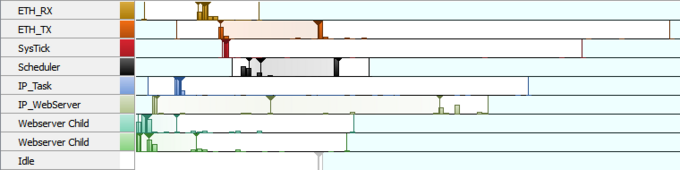
The target generates events on enter and leave of interrupts, when tasks become ready for execution, and when a task starts or stops execution. The SystemView Application plots these events in the Timeline Window and shows the context in which they happen.
This enables easy analysis of when, how long, and why tasks run or what happens on an interrupt.
This helps identify issues and inefficiencies, such as:
- Incorrect task priorities or priority inversion leading to starvation
- Incorrect inter-task communication
- Inefficient delays and timeouts
- Questionable or unnecessary interrupts
Optimizing the performance of tasks
CPU cycles are limited on embedded systems, making it important to optimize the performance of tasks as well as to get the order of execution and the time distribution right.
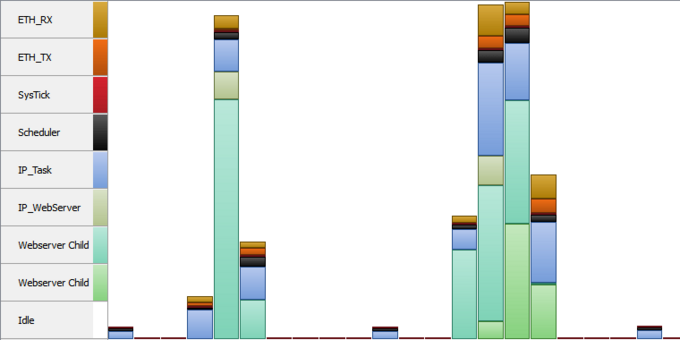
With the CPU Load Window, SystemView helps analyze where CPU load is high. By knowing what happens at or before high-load times, the system can be tuned to avoid bottlenecks which may lead to delayed execution of important tasks.
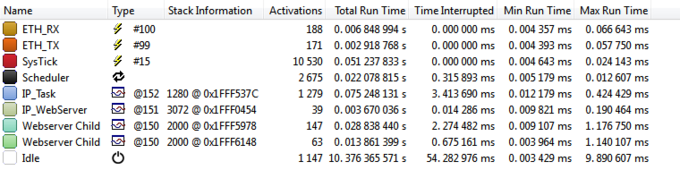
The Runtime Window provides additional information about the runtime distribution of contexts. It can be used to verify that each context runs within its timing limits or to find cases where a context unexpectedly runs too long.
Tracking and measuring performance
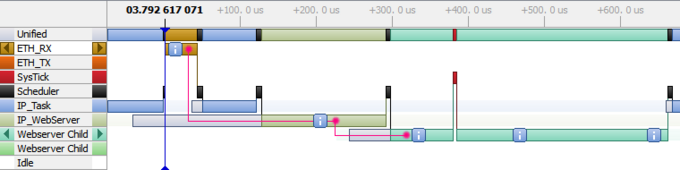
SystemView set up events especially suited to mark certain points in a target system. To easily measure the duration from point A to point B, or from point A through B to point C, marker start, mark, and marker stop events can be generated. The SystemView Application automatically links corresponding markers and adds more information, such as run time and run count of the measurement.
Logging output
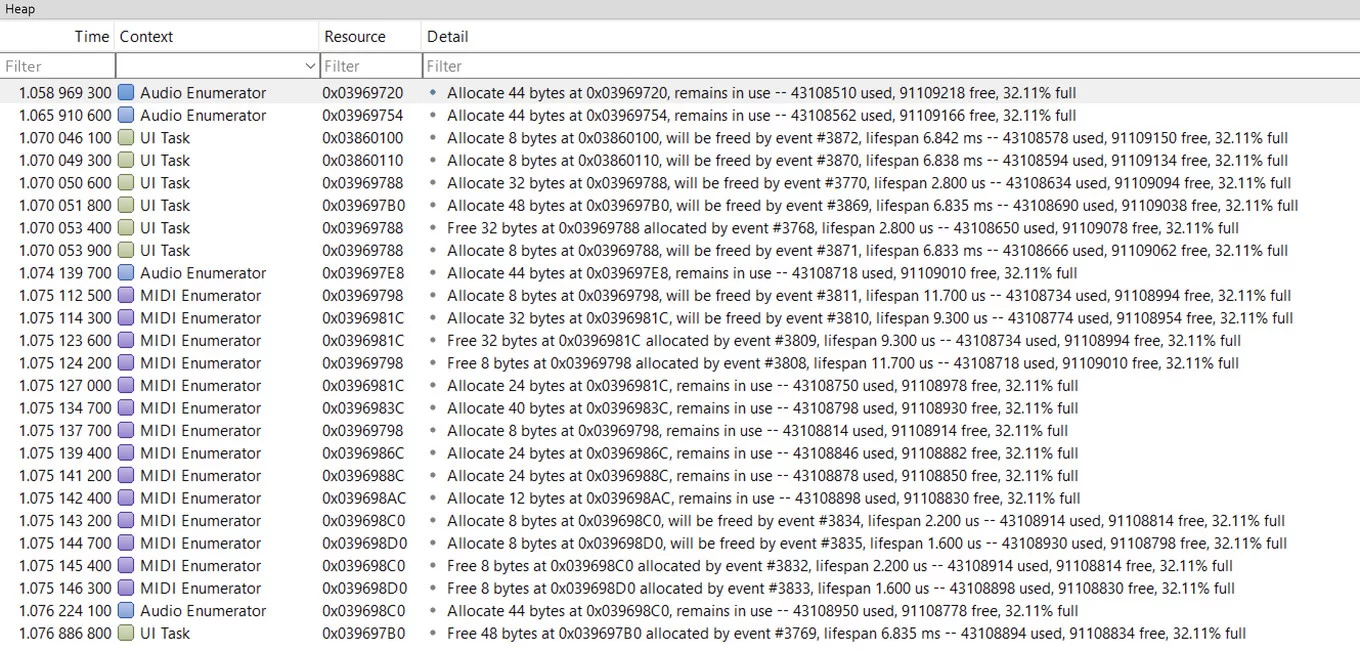
SystemView includes logging of messages with a recording. Simple strings can be recorded as a log, warning, or error message. The logging functions support formatting of strings, similar to printf(). Since formatting strings can be time-consuming and requires additional memory, this can be deferred to the SystemView Application. The target system simply records the format string and the parameters in an event. Then the SystemView Application takes care of formatting the string and prints it in the Terminal Window.Heap monitoring
SystemView monitors heap memory allocation. In many cases, memory can be allocated for the lifetime of the application without a problem. A problem occurs when the peak load of the heap increases over time, i.e. the application is consistently increasing the amount of memory it uses. This means the application is leaking memory and will eventually run into trouble. With SystemView’s heap memory monitoring it is easy to see where memory allocations are made, providing clues to where the leak may be.